The pattern sheet
The classical chart patterns on one sheet — what a pattern actually is, how to read the four bands, and why the shape alone is never the signal.
Every trader ends up with the same two dozen shapes taped to the inside of their skull. I drew mine once, properly, so I could stop redrawing them badly on napkins. This is that sheet — the classical vocabulary of price structure, one page, four bands.
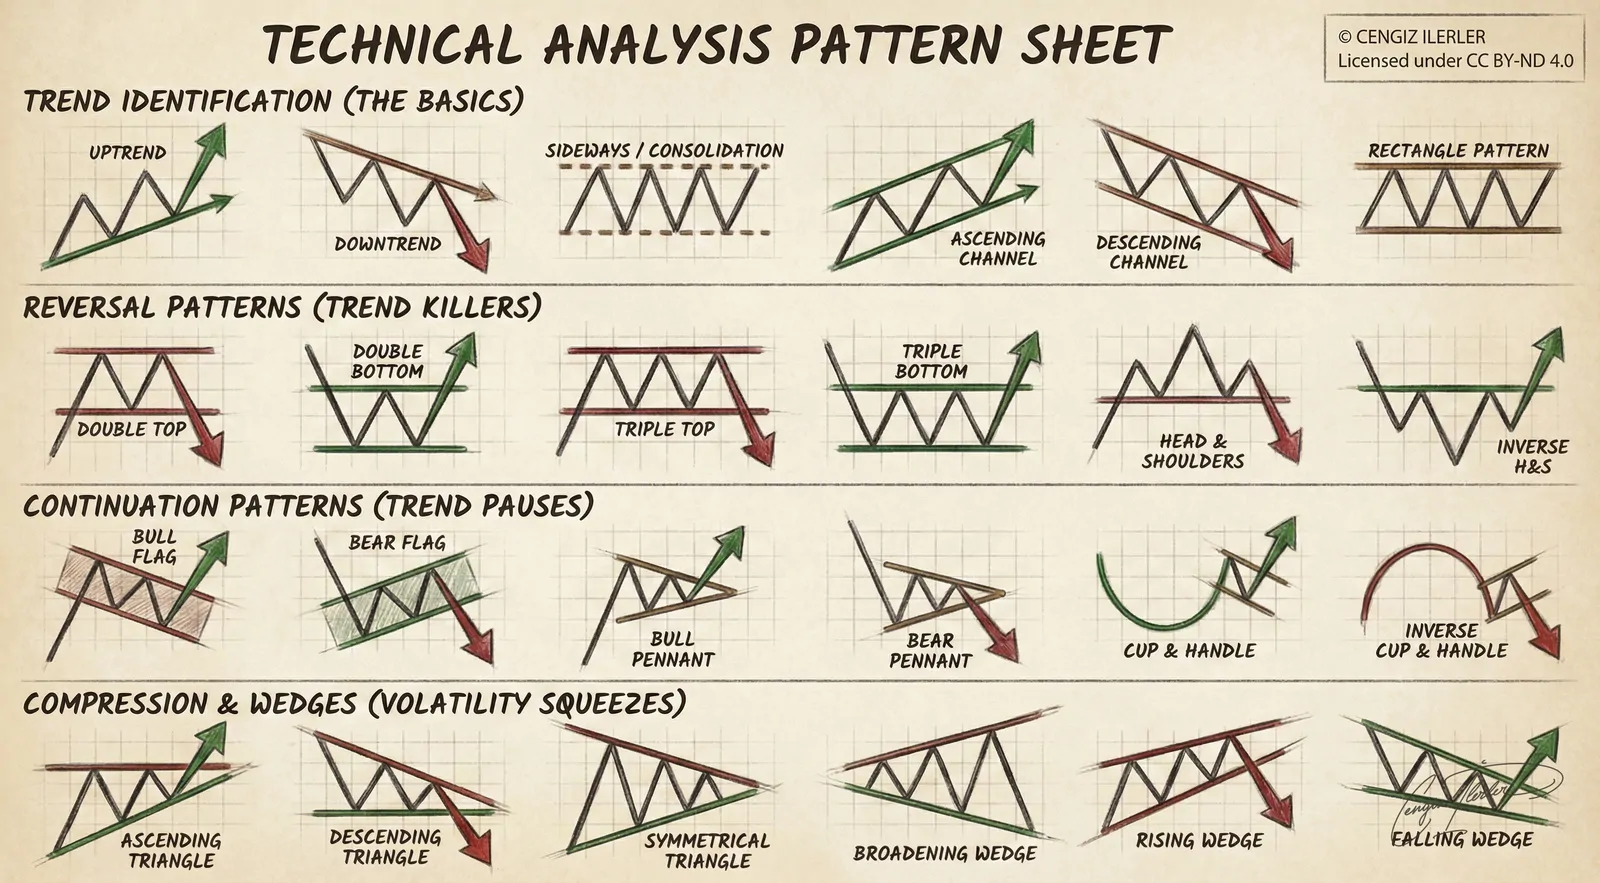
Drawn by me, licensed CC BY-ND 4.0 — take it, share it, don’t remix it.
What a pattern actually is
None of these shapes is magic. Each one is crowd behavior drawn as geometry: buyers and sellers negotiating in public, leaving a paper trail. A double top isn’t a “sell signal” — it’s the visible record of demand failing at the same price twice. A flag isn’t a “buy signal” — it’s the crowd catching its breath after a sprint. The label matters less than the logic underneath it: who is trapped, where their stops are sitting, and what price would break the current agreement.
How to read the sheet
Read the bands, not the shapes. They are ordered as questions:
- Trend identification — is there a trend at all? Everything else is meaningless until this is answered. Half of all trading mistakes are trend techniques applied to sideways tape.
- Reversal patterns — is the trend ending? These only exist at the end of a move. A head & shoulders in the middle of chop is just noise wearing a costume.
- Continuation patterns — is the trend resting? Pauses, not endings. The move before the pattern is half the pattern.
- Compression & wedges — is energy building? Volatility contracts, then it doesn’t. These tell you when something is coming sooner than they tell you which way.
Two rules make the whole sheet honest. First, context does the heavy lifting: the same shape means different things at a major level versus the middle of nowhere, with volume confirming versus volume asleep. Second, the arrow is earned, not promised: every drawing shows an exit direction, and it counts only after price actually leaves the structure. Trading the shape before the break is how patterns acquire their bad reputation — and a failed pattern is information too, often better information than the pattern itself.
These are notes on my own screen, not a recommendation. The sheet is a vocabulary, not a strategy — and markets take money from people who borrow other people’s setups without knowing why each piece is there.